5 Tracker Charts That Explain a Bad Training Week
Quick Answer: Most people look at their tracker’s daily summary and nothing else, which is the least informative view available. When a week goes badly, five specific charts usually explain it: sleep timing consistency, resting heart rate trend, heart rate variability trend, daily movement outside workouts, and training load distribution. Each takes about thirty seconds to read, and between them they account for most of the bad weeks that feel unexplained.
The week went badly and you do not know why.
You have been wearing a device that recorded the answer.
Five charts, in the order worth looking at them.
This is general information, not medical advice.

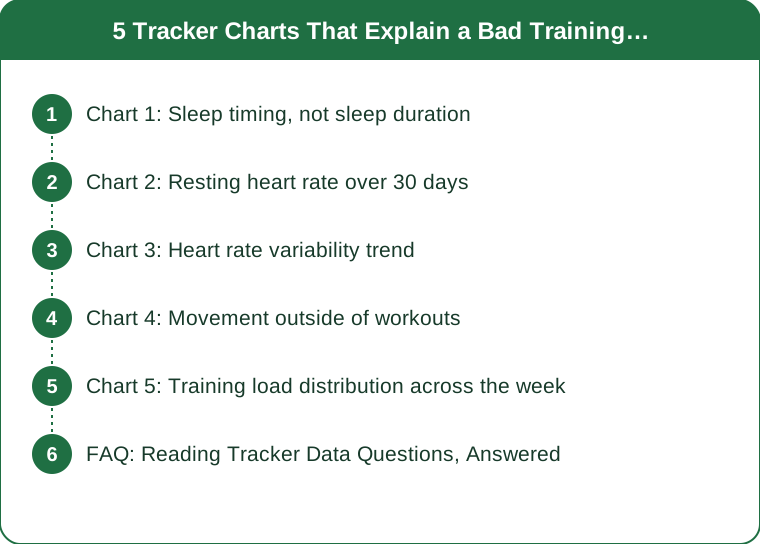
Chart 1: Sleep timing, not sleep duration
The screen to open: your sleep log for the past two weeks, viewed as bed and wake times rather than as total hours.
What you are looking for is the shape of the bars, not their length. Most sleep screens default to showing duration, which is the less actionable of the two numbers. Timing consistency has a strong relationship with sleep quality, and it is far easier to change than duration.
The pattern that explains bad weeks: weekday bed times within a narrow band, then a weekend that shifts one to two hours later, then a Sunday night that will not start. This is the single most common finding in this whole list.
What to do with it: fix wake time first, before bedtime. Wake time anchors the rhythm and is the one you have most control over. Within about an hour across all seven days is the working target.
A second thing to look for on this screen: nights where sleep started much later than usual and the following day’s session quality. The relationship is usually obvious once you look, and it is usually a one-day lag rather than same-day.
Chart 2: Resting heart rate over 30 days
The screen to open: resting heart rate, monthly view, as a trend line rather than a daily figure.
Single-day values are noisy and not very useful. The trend is where the information is. A resting heart rate elevated several beats above your own baseline for several consecutive days is one of the more reliable indicators that something is going on - accumulated fatigue, illness coming on, poor sleep, alcohol, or high stress.
Read it against your own baseline, not against population norms. What counts as elevated is relative to your normal, and the population averages on the screen are not useful for this purpose.
The pattern to look for on a bad week: a step up that began three or four days before the week felt bad. This is the chart most likely to have warned you in advance, and almost nobody checks it prospectively.
What to do with it: a sustained elevation is a reason to reduce intensity for a few days rather than to push through. If it stays elevated for more than about a week without an obvious cause, that is worth mentioning to a doctor.
One caveat worth knowing: alcohol raises resting heart rate substantially for a night or two, which accounts for a lot of otherwise mysterious spikes.
Chart 3: Heart rate variability trend
The screen to open: HRV, 30-day view, ignoring the daily number entirely.
HRV is the most misused metric on most devices. Day-to-day variation is large and normal, and treating a single low reading as meaningful produces a lot of unnecessary anxiety.
The trend across one to two weeks is what carries information. A sustained downward trend relative to your own baseline is associated with accumulated stress load - training, life, sleep, illness, all of it combined and not distinguishable from each other.
How to read it usefully:
- Compare a weekly average to the previous weekly average, not today to yesterday
- Look at it alongside resting heart rate. The two moving together in opposite directions - HRV down, RHR up - is a considerably stronger signal than either alone
- Ignore absolute values. HRV varies enormously between individuals and comparing yours to anyone else’s is meaningless
What to do with it: a sustained decline alongside elevated resting heart rate is a genuine reason to take an easier few days. A single low day is not.
And the honest caveat: HRV from a wrist device is less accurate than a chest strap, and less accurate again during movement. Overnight readings from a consistent position are the most usable.

Chart 4: Movement outside of workouts
The screen to open: daily steps or active minutes for the past two weeks, with your workouts mentally subtracted.
This is the chart that explains the most bad weeks and gets checked the least. Non-exercise movement is a large part of daily energy expenditure and has a strong relationship with how a day feels, and it collapses without anyone noticing.
What to look for: days under about 3,000 steps outside training. These cluster - a busy work week produces four or five of them in a row - and they correlate with fatigue far more strongly than most people expect.
The pattern that catches people out: a week with good workouts and terrible non-exercise movement often feels worse than a week with mediocre workouts and plenty of walking. The training was fine; the other 23 hours were not.
Autumn makes this worse in a specific way. Movement drops as the weather turns and daylight shortens, and the drop is gradual enough to be invisible without the chart.
What to do with it: add two short walks on desk-heavy days rather than adding training. This is a much easier fix than it looks, and it addresses the actual gap.
Chart 5: Training load distribution across the week
The screen to open: weekly training summary, looking at how the load is spread rather than the total.
Total weekly volume tells you very little on its own. The distribution tells you why Thursday felt terrible.
Two patterns to look for:
- Back-to-back hard days. Two hard sessions on consecutive days with nothing easy between produces a fatigue that shows up two days later, which is why the bad day so often has no obvious cause on the day itself
- The weekend spike. Very little Monday to Friday, then a large weekend block. This is extremely common and it produces a predictable Monday and Tuesday
What a better distribution looks like: hard sessions separated by at least one easier day, and total load spread more evenly across the week rather than concentrated.
What to do with it: move one session rather than removing one. Most badly distributed weeks are fixed by shifting a single session by a day, which costs nothing in volume.
And a final note on all five charts: the value is not in any one screen but in reading them together. Elevated resting heart rate plus declining HRV plus poor sleep timing plus low non-exercise movement is a coherent story, and any one of them alone is just noise. Five minutes on a Sunday covers all of it.
FAQ: Reading Tracker Data Questions, Answered
Which single metric is most useful?
Resting heart rate trend, because it is relatively reliable on wrist devices, responds to a wide range of stressors, and is easy to read against your own baseline. HRV adds information when read alongside it rather than alone.
How accurate is any of this?
Steps and heart rate at rest are reasonably reliable on modern devices. Sleep staging, calorie burn and recovery scores are considerably less so. Use the metrics that measure something directly, and treat composite scores as rough guides.
Should I act on a single bad reading?
No. Day-to-day variation in HRV and resting heart rate is large and normal. Multi-day trends are what carry information, and reacting to single readings produces anxiety rather than better decisions.
Why does my recovery score disagree with how I feel?
Recovery scores are algorithmic estimates built from a handful of inputs, and they cannot see your work stress, your last meal or your mood. When the score and your own sense disagree, your own sense is usually the better guide.
How often should I look at these charts?
Once a week, for about five minutes. Daily checking encourages reacting to noise, and the trends that matter are only visible across one to two weeks anyway.
Do I need a premium subscription for this?
Not for these five. Sleep times, resting heart rate, steps and a weekly training summary are available on essentially every device without a subscription. HRV trends are sometimes gated, and are the least essential of the five.
TL;DR:
- The daily summary screen is the least informative view your tracker offers
- Sleep timing consistency explains more bad weeks than sleep duration does
- Read resting heart rate and HRV as multi-week trends against your own baseline, never as single days
- HRV down and resting heart rate up together is a real signal; either alone is noise
- Non-exercise movement is the most overlooked chart and explains the most unexplained fatigue
- Look at how training load is distributed, not the weekly total - one moved session usually fixes it
Five minutes on a Sunday, five charts. Most bad weeks stop being mysteries.
Keep Reading
This article is for general informational and styling purposes only. Fit, sizing, and product availability may vary.