5 Tracker Screens Worth Checking — and What Each One Is Really Telling You
Quick Answer: Five screens are worth your attention — resting heart rate, heart rate variability, sleep duration, step count, and time in zone 2. Everything else on a consumer tracker is either derived from those, or measured too imprecisely to act on. The trend over a week matters; the single day almost never does.
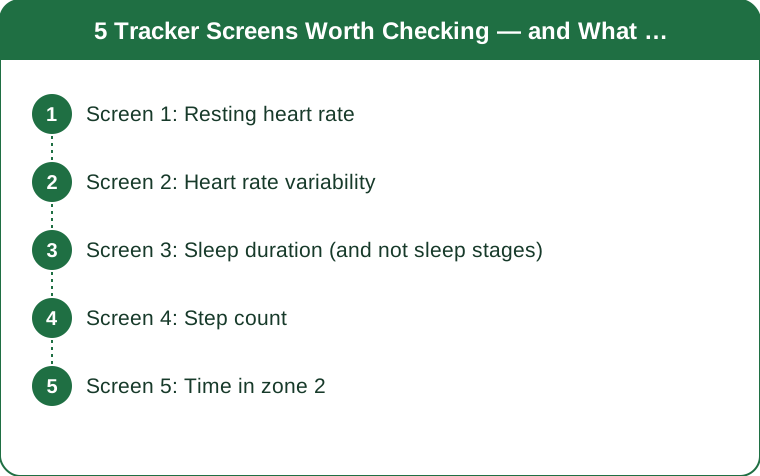
Here they are one at a time, in the order of how much they should influence what you actually do.

Screen 1: Resting heart rate
What you are looking at: your lowest sustained heart rate, usually captured during sleep.
Why it earns first place: it is the most reliably measured number on the device. Optical sensors are at their most accurate when you are still, warm, and not moving your wrist, which describes sleep exactly.
What it tells you: fitness improves and it drifts down over months. Illness, alcohol, poor sleep, heat, and heavy training push it up within a day.
How to read it: compare today against your own 30-day average, not against anyone else. A rise of 5-7bpm above your baseline is a meaningful signal — usually the day before you notice you are getting ill.
What it does not tell you: anything useful in isolation. One high morning after a late dinner and a glass of wine is not a training decision.
Practical use: if it is elevated more than about 5bpm for two consecutive mornings, make it an easy day. That single rule is worth more than most of the rest of the device.
Screen 2: Heart rate variability
What you are looking at: the variation in time between heartbeats, in milliseconds, as a proxy for autonomic nervous system balance.
Why it is useful and frustrating: it responds to stress of every kind — training, work, alcohol, illness, poor sleep — which makes it sensitive and non-specific at the same time.
How to read it: absolute values are meaningless between people. A HRV of 40 is excellent for one person and low for another. Your own seven-day rolling average against your 60-day average is the only comparison worth making.
The most common mistake: reacting to a single low day. Day-to-day HRV noise is large, and chasing it produces anxiety rather than better training.
What actually moves it: alcohol reduces it more reliably than almost anything else, often by 20-30% for a night. Late meals, a hot room, and travel do too.
Practical use: a downward trend across a week alongside a rising resting heart rate is the clearest overreaching signal a consumer device can give you. Together they are far more informative than either alone.
Screen 3: Sleep duration (and not sleep stages)
What you are looking at: total time asleep, and a breakdown into light, deep, and REM.
The uncomfortable truth: total duration is measured reasonably well. Sleep stages are not. Consumer wearables estimate stages from movement and heart rate, and validation studies against clinical polysomnography consistently show moderate agreement at best — often in the 50-70% range for stage-level accuracy.
How to read it: trust the total, treat the stages as entertainment. If the app says you got six hours, you probably got roughly six hours. If it says you got 40 minutes of deep sleep, that number could easily be half or double.
The bedtime consistency number is underrated. Variability in sleep timing predicts how you feel more strongly than duration does for many people, and it is easy to measure.
Practical use: track average duration and bedtime consistency weekly. Ignore the stage chart entirely — it generates more anxiety per unit of information than any other screen on the device.
Screen 4: Step count
What you are looking at: the oldest and least glamorous metric, and the one with the strongest evidence base behind it.
Why it matters: the association between daily step count and health outcomes is one of the more robust findings in the whole space, with most of the benefit accruing between roughly 4,000 and 8,000 steps a day and diminishing returns beyond that.
Why 10,000 is arbitrary: the number came from a 1960s Japanese pedometer marketing campaign, not from research. It is a fine target, but there is nothing magic about it and the meaningful gains happen well below it.
Accuracy: step counting is genuinely accurate on wrist devices during walking — usually within 3-5%. It over-counts during activities involving arm movement and under-counts pushing a trolley or a buggy.
Practical use: this is the number to watch in autumn specifically. Daily steps drop measurably as evenings shorten, usually by 15-20% between August and November, and almost nobody notices without the data.
Screen 5: Time in zone 2
What you are looking at: minutes spent at a moderate, conversational intensity — roughly 60-70% of maximum heart rate.
Why it is the most actionable training metric on the device: most recreational exercisers train too hard on easy days and not hard enough on hard days. Zone 2 time is the number that reveals it.
How to read it: if you exercise four times a week and your zone 2 minutes are near zero while zone 3 is large, you are living in the moderate-hard middle, which produces fatigue without the adaptations of either end.
A caution on accuracy: wrist optical heart rate is at its worst during intervals and weight training, where it commonly lags or locks onto cadence. For steady cardio it is usually within a few beats.
Practical use: aim for the majority of your weekly aerobic minutes in zone 2 and a small deliberate portion genuinely hard. The device is good enough to tell you whether you are doing that, and that is the single most useful thing it does.
One overall caveat: none of these numbers diagnose anything. Persistent unexplained changes in resting heart rate or genuine symptoms belong with a clinician, not an app. This is general information, not medical advice.
TL;DR:
- Resting heart rate is the most reliable number on the device — two mornings 5bpm high means take it easy.
- HRV is useful as a weekly trend against your own baseline, and useless as a daily verdict.
- Trust sleep duration and bedtime consistency; ignore the stage breakdown, which is poorly validated.
- Step count has the strongest evidence base and drops 15-20% in autumn without anyone noticing.
- Zone 2 minutes reveal whether your easy days are actually easy, which is the most common training error.
Five screens, one rule underneath all of them: read the week, not the day.
Keep Reading
This article is for general informational and styling purposes only. Fit, sizing, and product availability may vary.