5 Tracker Readings That Change in Autumn - and What Each One Means
Quick Answer: Five tracker metrics shift predictably as summer ends: resting heart rate falls slightly, sleep scores drop, step count falls by thousands without any decision, HRV becomes more variable, and recovery scores worsen. Four of the five are normal seasonal responses that need no action. The one worth acting on is the step count, because it is a real change in behaviour rather than a change in physiology.
If you only check one number in September, make it total daily steps compared with July.

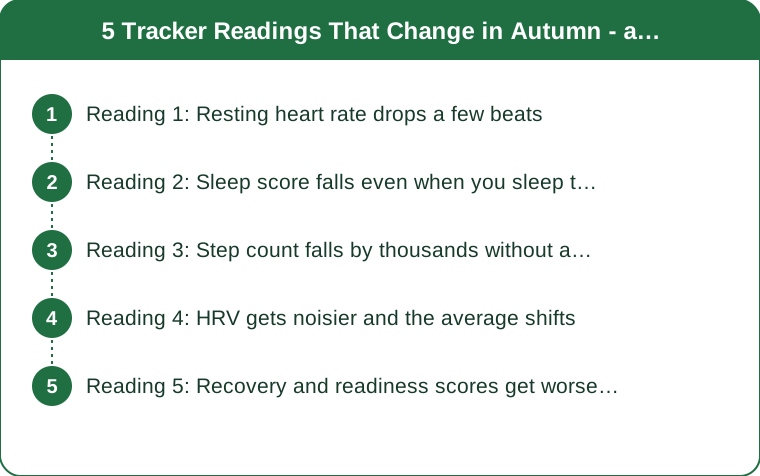
Reading 1: Resting heart rate drops a few beats
Usually a temperature effect rather than a fitness improvement, and it is the most commonly misread number.
What you see. A drop of 2 to 5 beats per minute through late summer into autumn, appearing over a few weeks with no change in training.
Why it happens. In hot weather, the body increases skin blood flow to lose heat, which requires higher cardiac output and raises resting heart rate. As ambient temperature falls, that demand drops away.
Which means summer’s readings were the outliers, not autumn’s. A resting heart rate that looked elevated in July was mostly thermoregulation.
How to tell it apart from a genuine fitness gain:
- A temperature effect appears within days to a couple of weeks of a sustained drop in ambient temperature
- A fitness gain appears gradually over 6 to 8 weeks of consistent training and is accompanied by better performance
- Check the trend against outdoor temperature, which most weather apps will show retrospectively
What actually deserves attention. A rise of 5 or more beats sustained over several days, which suggests illness, poor sleep, alcohol, or accumulated training fatigue. The rise is informative; the seasonal fall is mostly not.
Reading 2: Sleep score falls even when you sleep the same hours
A timing and light problem showing up as a quality metric.
What you see. Same time in bed, worse score. More time reported awake, less deep sleep, and later sleep onset.
Why it happens:
- Later sunrise means later morning light, which delays circadian phase while your alarm does not move
- A schedule change compresses the wind-down window
- Room temperature is often wrong in transitional weather - too warm with the heating on, too cold without it. Sleep quality is sensitive to a fairly narrow temperature band
What is real and what is measurement. Consumer trackers estimate sleep stages from movement and heart rate, and stage estimates are considerably less accurate than total sleep duration. Treat the stage breakdown as a rough trend and the duration as reasonably reliable.
What to act on:
- Morning light within an hour of waking, which addresses the actual cause
- A bedroom around 16 to 19C, which suits most people
- Consistent wake time including weekends, which does more for sleep scores than anything else
What to ignore. A single bad night, and the deep sleep percentage in isolation. Weekly averages are the only level at which these numbers mean much.

Reading 3: Step count falls by thousands without a decision
The one metric on this list worth genuinely acting on.
What you see. A drop of 1,500 to 3,000 daily steps from summer to autumn, appearing over a few weeks.
Why it happens. Daylight after work disappears, outdoor activities end, and incidental walking - to the shops, around a garden, on an evening out - simply stops. Nobody decides this. It is a consequence of the calendar.
Why it matters more than the other four. Non-exercise activity is a large fraction of daily energy expenditure, and prolonged sitting has health effects independent of structured exercise. A gym session does not offset a sedentary day, which is one of the more consistent findings in this area.
What to do:
- Compare a week in September against a week in July on your tracker. The gap is usually larger than people guess
- Set a floor rather than a target - a number you hit on your worst day, often 6,000 to 7,000
- Move walking to the morning, since evening daylight goes first
- Attach a fixed walk to an existing daily event rather than relying on intention
The reason this is the one to act on. The other four metrics reflect physiology adapting to a season. This one reflects a genuine behaviour change with real consequences, and it is entirely reversible once noticed.
Reading 4: HRV gets noisier and the average shifts
Real, mostly benign, and the metric people most often over-interpret.
What you see. More day-to-day variation, and often a small drop in the weekly average.
Why it happens:
- Heart rate variability is sensitive to sleep, stress, alcohol, illness and training load - and a schedule transition disturbs several at once
- HRV is also temperature-sensitive, and transitional weather means more variable overnight conditions
- Measurement conditions matter enormously. HRV is only comparable when taken at the same time, in the same position, under similar conditions
What HRV is actually good for. Detecting your own trend against your own baseline over weeks. It is not comparable between people, and absolute values are close to meaningless across individuals.
How to read it properly:
- Use a 7-day rolling average, never a single reading
- A drop of more than about 10 percent from your rolling baseline, sustained several days, is the signal - alongside how you actually feel
- A single low morning after a late night and a glass of wine is expected, not informative
The most common mistake. Adjusting training daily based on a single HRV reading. The noise in daily measurement is larger than most of the signal, and chasing it produces inconsistent training for no benefit.
Reading 5: Recovery and readiness scores get worse across the board
A composite of the four above, which means it inherits all their seasonal noise.
What you see. Readiness or recovery scores trending lower through September with no change in training.
Why it happens. These scores are calculated from sleep, HRV, resting heart rate and recent activity - and three of those four are shifting seasonally. A composite of shifting inputs shifts.
What it genuinely reflects. A schedule transition really does reduce recovery capacity for a few weeks: less sleep, more stress, disrupted routine. The score is not wrong; it is just not telling you anything you did not already know.
How to use it usefully:
- Compare against your own recent average, not against 100
- Look for multi-day patterns, not single scores
- Use it to decide between a hard session and a moderate one, not between training and not training
- Trust how you feel over the number when they disagree. Subjective readiness has held up well in research relative to consumer device scores
When any of these five actually warrant action. A sustained rise in resting heart rate with a drop in HRV and worsening sleep, all together, for more than a few days - that combination is worth taking seriously as illness or accumulated fatigue. Any one of them alone, in September, is probably just the season.
TL;DR:
- A resting heart rate drop in autumn is usually thermoregulation, not a fitness gain - the summer readings were the outliers
- Sleep scores fall because later sunrise delays your body clock while the alarm does not move
- Step count falls 1,500 to 3,000 a day without a decision - this is the one worth acting on
- Read HRV as a 7-day rolling average against your own baseline, never as a single morning reading
- Recovery scores inherit all of the above, so compare against your own recent average rather than an absolute
Four of these five numbers are your body responding to a season. One is your behaviour changing without your permission. Check the step count.
Keep Reading
This article is for general informational and styling purposes only. Fit, sizing, and product availability may vary.