5 Tracker Screens Worth Checking Daily - and the Ones That Just Make You Anxious
Quick Answer: The metrics worth a daily look are the ones you can act on within the next 24 hours: sleep duration, resting heart rate trend, a readiness or recovery score used loosely, total daily movement, and time in your target training zones. The ones that generate anxiety without changing behaviour are single-night HRV readings, sleep stage percentages, blood oxygen, stress scores, and any number compared against other users. Look at trends over a week, not points.
The watch has produced a lot of information overnight and it would like you to have opinions about all of it. Most of it is not actionable and some of it is actively misleading at the daily resolution it is presented in. Here are the five screens that earn their place.

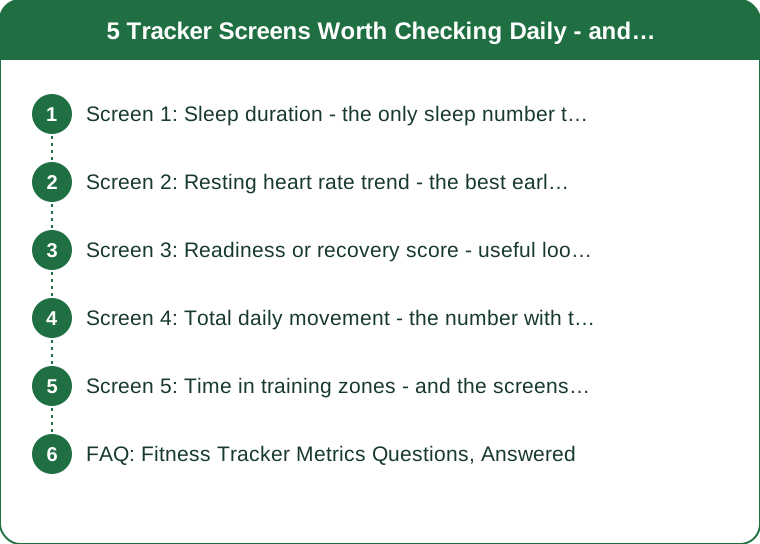
Screen 1: Sleep duration - the only sleep number that matters daily
What it tells you: roughly how long you were asleep. Consumer wearables estimate total sleep time reasonably well - typically within about half an hour of laboratory measurement, which is good enough to be useful.
Why it is actionable: it is the one metric with an obvious lever. Short last night means an earlier night tonight, an easier training session today, or both. That is a decision you can make at breakfast.
What to look at: the seven-day average, not last night. A single short night is normal and largely unimportant; four short nights in a row is the thing worth responding to. Most trackers bury the weekly average behind the nightly number, which is exactly backwards for how the data should be used.
What to ignore on this screen: the sleep stage breakdown. Consumer devices estimate deep and REM sleep from movement and heart rate, and their agreement with proper sleep staging is genuinely poor - considerably worse than their accuracy for total duration. Worrying about a deep sleep percentage is worrying about a number that may not be measuring what it claims.
The trap: orthosomnia - anxiety about sleep data that itself worsens sleep - is a documented phenomenon and it is common. If checking your sleep score makes you feel worse about a night you thought was fine, the score is costing you more than it provides.
Screen 2: Resting heart rate trend - the best early warning available
What it tells you: your heart rate at rest, typically overnight or on waking. This is one of the most accurate things a wearable measures, because it does not require the device to infer anything complicated.
Why it is actionable: a resting heart rate elevated by five or more beats over your personal baseline for two consecutive days is a genuinely useful signal. It commonly precedes illness by a day or two, and it reliably reflects incomplete recovery, alcohol, poor sleep, or high stress.
How to use it: know your normal range, and treat a sustained elevation as a reason to make today easier rather than harder. That is one decision, made from one number, and it is the single most practically useful thing most wearables produce.
What to look at: the 30-day trend line. A slow downward drift over months usually indicates improving fitness. A slow upward drift warrants attention, particularly alongside fatigue.
What to ignore: any single morning. Resting heart rate varies day to day for a dozen reasons including room temperature, when you last ate, and what time you woke. Two consecutive days is the threshold; one day is noise.
A persistently elevated resting heart rate, or a sudden unexplained change, should be discussed with a healthcare professional rather than managed by training adjustment. This is general information, not medical advice.
Screen 3: Readiness or recovery score - useful loosely, harmful precisely
What it tells you: a composite score, usually blending resting heart rate, heart rate variability, sleep, and recent training load into one number out of 100.
Why it can be actionable: as a coarse three-band signal - low, normal, high - it is a reasonable prompt to consider adjusting the day. It aggregates several inputs, which makes it less noisy than any of them alone.
How to use it well: treat it as three categories, not a number. Below your usual range means consider an easier session. Within range means proceed. Above means today is a good day for hard work if you have it planned. The difference between a 71 and a 78 is meaningless and treating it as meaningful is where this metric starts causing harm.
The specific trap: letting the score override how you feel. If the score says 45 and you feel excellent, you feel excellent. The score is an estimate built on proxy measurements; your own perception of readiness is data too, and in several studies it predicts performance about as well.
And a real risk worth naming: some people find that a low readiness score becomes a self-fulfilling prophecy, producing a worse session than would otherwise have happened. If you notice that pattern in yourself, check the score after training rather than before. It loses nothing and removes the effect entirely.

Screen 4: Total daily movement - the number with the most evidence behind it
What it tells you: steps, active minutes, or total movement across the day. Unglamorous, and the best-supported metric on the whole device.
Why it is actionable: it is visible mid-day and can be changed mid-day, which almost nothing else on this list can. A 3pm glance showing a low number leads directly to a walk, and that walk is a real health input.
What the evidence says: the relationship between daily step count and mortality risk is one of the more robust findings in activity research, with benefits accruing well below the arbitrary 10,000 figure - meaningful reductions appear from around 4,000 to 6,000 steps and continue improving up to around 8,000 to 10,000 for most adults.
How to use it: set a floor rather than a target. “Never below 5,000” produces more consistent behaviour than “aim for 10,000”, because a floor is achievable on a bad day and a target that is missed by 3pm gets abandoned.
What to ignore: the exact step count. Wrist-based counting has real error, particularly when pushing a trolley or a pram, and comparing your count to someone else’s device is meaningless. The trend for you, measured by the same device, is the only comparison that means anything.
And the seasonal note: daily step counts drop measurably as daylight shrinks through autumn. Watching your own number decline from September onward is a genuinely useful prompt to protect a daily walk before the habit disappears entirely.
Screen 5: Time in training zones - and the screens to skip entirely
What time in zones tells you: how much of your training week was actually easy and how much was actually hard. This is the metric most likely to change how you train, because most people’s easy sessions are too hard and their hard sessions are not hard enough.
Why it is actionable: it is a weekly review number that reshapes next week’s plan. If almost everything sat in the middle zones, the fix is specific - make the easy sessions genuinely easy and let one session be genuinely hard.
How to use it: look weekly, not daily. Aim for the large majority of your training time at an easy conversational intensity, with a smaller portion at genuinely hard efforts. The exact ratio varies by sport and goal, but the common error is universal: too much time in the middle.
The screens to skip
Single-night HRV. Heart rate variability is genuinely informative as a multi-week trend and almost useless as a single reading. It varies enormously night to night with position, temperature, alcohol, and measurement noise. Look at it monthly or not at all.
Sleep stage percentages. As covered above, the underlying estimation is weak. Total duration is the sleep number that survives scrutiny.
Blood oxygen, for healthy people. Consumer pulse oximetry at the wrist has meaningful error, and in the absence of a specific medical reason to monitor it, the readings generate concern far more often than insight.
Stress scores. Usually derived from heart rate variability with the same noise problem, and there is something genuinely counterproductive about a device informing you that you are stressed.
Anything comparing you to other users. Age-group percentiles and community rankings compare your device’s estimates to other people’s device estimates across different hardware, wear positions, and body types. The comparison is not measuring what it appears to measure, and it reliably produces feelings rather than decisions.
If a device flags a genuinely abnormal reading - a heart rhythm alert, a persistently abnormal oxygen level - that is worth discussing with a healthcare professional. This is general information, not medical advice.
FAQ: Fitness Tracker Metrics Questions, Answered
Which fitness tracker metrics actually matter?
Sleep duration, resting heart rate trend, a readiness score used as three coarse bands, total daily movement, and weekly time in training zones. Those five can each change a decision within the next day or week, which is the test any metric should have to pass.
Is heart rate variability worth checking daily?
No. HRV varies substantially night to night from position, temperature, alcohol, and measurement noise, so a single reading carries very little information. It is genuinely useful as a multi-week trend and mostly generates anxiety at daily resolution.
Are sleep stages from a smartwatch accurate?
Total sleep duration is estimated reasonably well - usually within about half an hour. Sleep stage breakdown is much less reliable, because devices infer stages from movement and heart rate rather than brain activity. Use the duration and ignore the percentages.
Can fitness trackers make you more anxious?
Yes, and it is documented - orthosomnia describes anxiety about sleep tracking data that itself worsens sleep. If a score regularly makes you feel worse about a night or a day you thought was fine, checking it after training rather than before, or turning that metric off, is a reasonable response.
TL;DR:
- Keep five screens: sleep duration, resting heart rate trend, readiness in three bands, daily movement, weekly time in zones.
- Every one of them passes the same test - it changes a decision within a day or a week.
- Resting heart rate five beats up for two days running is the single most useful signal available.
- Skip single-night HRV, sleep stages, blood oxygen, stress scores, and all user comparisons.
- Trends over a week; points are noise wearing a decimal place.
Forty numbers, five decisions. The other thirty-five are your body’s weather report, and you cannot change the weather by reading about it at 6am.
Keep Reading
This article is for general informational and styling purposes only. Fit, sizing, and product availability may vary.